L01: The Photon's path from stars to the telescope


All we learn about astrophysical objects has been been deduced from the light that arrives at our telescopes. But first, that light must travel from the object to us, passing through space, our atmosphere, and the telescope before we can record an image. In this lecture we look at how that journey affects what we can observe, how well we can observe it, and what we expect to see in our images.

Before the light even reaches Earth, it has to travel through space. Space is not empty, and the light travels through sparse dust and gas which absorbs and scatters the light. This interstellar extinction both reduces and reddens the light which arrives at Earth. Before the light reaches our telescopes, it has to pass through Earth's atmosphere. This has a number of undesirable consequences.

Atmospheric Extinction
Figure 1: Views through the atmosphere (not to scale)

Dust particles and molecules in the atmosphere scatter and absorb the light. This causes a dimming and reddening, known as atmospheric extinction, to distinguish it from interstellar extinction.

The amount of dimming depends upon the local conditions in the atmosphere at the time of observation. It also depends on the angle of the object above the horizon (see figure 1). An object observed near the horizon is observed through a larger column of air, and suffers greater extinction

The extinction also depends strongly on the wavelength of the light (see figure 2). This is because the molecular absorption is strongly wavelength dependent. Below about 300nm, ultraviolet and X-ray light are absorbed by N2, O2 and O3 molecules. This makes the atmosphere totally opaque. The atmosphere is largely transparent (little absorption) in the optical region (between 300 and 900 nm). In the majority of the infrared region, absorption from H20, CO2 and O2 makes the atmosphere opaque, with the exception of some narrow wavelength regions in the near-infrared. The atmosphere is largely transparent to radio waves. At long wavelengths, however, reflection of radio waves by free electrons in the ionosphere makes the atmosphere opaque once again.

As a result, the ground-based astronomer is limited to observing in the optical, in radio waves, or in a few small wavelength regions in the near-infrared. Optical light is a narrow region of the electromagnetic spectrum, but crucial to astronomy. In this course we will only concern ourselves with the techniques and principles involved in optical astronomy. For a discussion of astronomical techniques at other wavelengths, see the course textbooks.

Figure 2: Sketch of the transparency of the Earth's atmosphere as a function of wavelength. Taken from Carrol & Ostlie.

Sky Background and Transparency

Transparency is related to extinction. In addition to the absorption from molecules and dust particles, clouds also absorb and scatter the light from astronomical objects. The amount of absorption is much more variable than extinction, as clouds are blown across the field of view by wind. The resulting variations in the amount of light received from an astronomical object range from partial attenuation due to thin cloud, to complete obscuration by thick cloud. The same dust and molecules that scatter the photons from our astronomical source, also scatter light from other sources (e.g street lighting, moonlight) into our telescope. The molecules in the atmosphere also emit light. As a result, the night sky is not black, but acts as a noisy background to the light detected from astronomical objects. The sky background can be brighter than faint stars, making the detection of faint sources difficult.


Diffraction and Resolving Power

We have seen that the atmosphere affects the amount and colour of light that reaches us. What is the effect on the quality of the images we take? To answer that question, let us pretend for a moment that atmospheric turbulence does not exist, and ask what happens to the photons from our object when they reach the telescope.

The resolving power (or resolution) of an astronomical telescope is a measure of its ability to distinguish fine detail in an image of a source. Aberrations due to the optical design or flaws in the manufacture and alignment of the optical components can degrade the resolving power, as does peering through the Earth's turbulent atmosphere. We shall come back to address these issues in later lectures. However, even if a telescope is optically perfect and is operated in a vacuum, there is still a fundamental lower limit to the resolving power it can achieve. This is known as the theoretical resolving power, and in this section we shall explore its origins and consequences.

Figure 3: Schematic showing wavefronts radiating from a point source at infinity and imaged by a telescope. The "aperture" in the figure represents an optical element, such as a mirror or lens, with the ability to bring light to a focus.Credit: Vik Dhillon

Figure 3 above shows a point source at infinity, i.e. a star radiating light into space. Considering the light as a wave, it is possible to define wavefronts, which are points of the wave at equal phase. As the wavefronts propagate from the star at the speed of light, their curvature decreases until they can be considered plane-parallel waves when they arrive at the top of the Earth's atmosphere. A crude analogy would be to consider the waves created when a stone is thrown into the centre of a pond. Close to where the stone entered the water, the wavefronts would be clearly defined circles, whereas by the time they reach the edge of the pond, they would be more or less straight and parallel to the edge of the pond.

In the absence of atmospheric turbulence, these plane wavefronts reach the aperture of our telescope. The telescope brings the plane-parallel waves incident upon the aperture into focus, forming an image of the star in the focal plane. It does this by inducing a phase change on the wavefront which varies across the telescope aperture. However, since the aperture does not cover the entire wavefront radiated by the star, but only a very small portion of it, a diffraction pattern is produced.

The diffraction pattern produced when imaging a point source with a lens-based telescope is shown in figure 4 below. The image appears as a spot surrounded by concentric rings which decrease in brightness with increasing distance from the centre. The bright central spot, known as the Airy disc after the British astronomer who first studied it, is theoretically predicted to contain 84% of the light, and the first ring contains less than 2%.

Figure 4: Schematic showing the diffraction pattern produced in the focal plane of a telescope when imaging a point source. \(\alpha\) is the angle between the centre of the Airy disc and the first minimum and denotes the theoretical resolving power of the telescope. Credit: Vik Dhillon

The size of the Airy disc puts a limit on the resolving power of a telescope. According to Rayleigh's criterion for resolution, two point sources are said to be just resolved when the centre of one Airy disc falls on the first minimum of the other diffraction pattern. This results in a 20% drop in intensity between the maxima, as illustrated in figure 5 below. An expression for Rayleigh's criterion can be obtained from theory by calculating the positions of minima of intensity in a point-source diffraction pattern. For the first minimum, this gives \[\alpha = 1.22 \lambda / D\] where \(\lambda\) is the wavelength of light and \(D\) is the diameter of the telescope aperture. \(\alpha\) is measured in radians and is the angle subtended at the aperture by the centre of the Airy disc and its first minimum in the focal plane (see figure 4 above). \(\alpha\) is commonly referred to as the theoretical resolving power or diffraction-limited resolution of a telescope.

Figure 5: Left: image of the overlapping diffraction patterns from two point sources separated by an angle \(\alpha\). Right: The black curve shows a cut through the image on the left. According to Rayleigh's criterion, the two sources are just resolved. Credit: Vik Dhillon

Atmospheric Turbulence and Seeing

Above, we considered what would happen if the atmosphere was not present. In fact, turbulence in the atmosphere degrades the resolution of the image recorded by a telescope. The effect of turbulence on images is called seeing. We shall look at the causes and effects of seeing in more detail below. The turbulence also causes a variation in the brightness of an image recorded by a telescope, a phenomenon known as scintillation (or, less formally, twinkling), but this will not be considered further here.

It is very important not to confuse seeing and transparency. The two effects are largely unrelated: in poorer seeing, the image of a star will be more blurred, but its brightness will remain constant; in poor transparency, the light from a star will be dimmed but its blurring will be largely unaffected.

Turbulence in the atmosphere occurs on all scales and results in adjacent pockets of air with slight temperature differences between them. Since the temperature of air affects its density, which in turn affects its refractive index, some rays of light from an astronomical source are bent by more than others. In terms of wavefronts, the plane wavefront from a star is corrugated by the atmosphere, as some parts of it are retarded in phase by more than others. This is shown schematically in figure 6 below.

Figure 6: Propagation of wavefronts through the atmosphere. Credit: Vik Dhillon

As before, we consider the wavefronts from the star which, by the time they reach Earth form a series of plane-parallel wavefronts. When these plane wavefronts travel through turbulent layers in the atmosphere, the turbulence corrugates the wavefronts.

The turbulent cells are around 10cm across, so the wavefronts produced can be thought of as lots of little plane wavefronts, about 10cm in length and with different angles. They are blown across our telescope aperture by the wind, and typical wind speeds mean that the shape of the wavefront arriving at our telescope will change every 10 milliseconds or so.

We can think about the image produced by one of these wavefronts - such as would be seen in a very short exposure of a few milliseconds. It can be seen from figure 7 that the image of a star will look very different through telescopes of different aperture. Small-aperture telescopes will collect portions of the wavefronts which do not have many corrugations. Since straight portions of a wavefront produce diffraction-limited images, the instantaneous image of a star in a small-aperture telescope (of order 10 cm, the typical size of the straight portion of a wavefront) will generally appear diffraction limited, as shown in the left-hand panel of figure 7, but the image will move around on timescales of a fraction of a second. This is because the straight portions of successive wavefronts have different slopes with respect to the telescope aperture and hence will be focused onto different points in the focal plane. The effect of exposing for many seconds or minutes then is to average out this image motion into a single blurred image of the star. This is known as the seeing disc.

Large aperture telescopes (>> 10 cm) collect wavefronts with many corrugations. Each of the straight portions of the wavefront are simultaneously brought to a sharp focus, but at positions in the focal plane dependent on their tilts. Hence the instantaneous image appears as small bright spots, or speckles, superimposed on a faint, blurred disc. The effect of accumulating many such images over the course of seconds or minutes is to average them out into a seeing disc similar to that seen through a small telescope.

Figure 7: Left: Example of a short-exposure (of order milliseconds) image of a point source through a ~10 cm ground-based telescope. The fact that the first diffraction ring can just be seen surrounding the Airy disc implies that the instantaneous resolution is close to the diffraction limit, but significant image motion would cause blurring in a longer exposure, similar to that shown in the right-hand panel. Centre: Short-exposure image of a point source through a ~1 m ground-based telescope. The image is broken up into bright, dancing speckles, which are smeared-out in the longer-exposure image shown in the right-hand panel. Credit: Vik Dhillon
Figure 8: Schematic showing the seeing profile of a star and how the FWHM is measured. Credit: Vik Dhillon

Seeing normally produces a star profile with a roughly Gaussian shape. A measurement of the full-width at half-maximum (FWHM) of the seeing disc gives a numerical value for the seeing, as shown in figure 8 (left)figure 8 (above) The figure shows brightness along a cut through the star. The value \(x_2-x_1\) is typically measured in pixels from an astronomical image and then converted to arcseconds using the plate scale of the telescope. Seeing as low as 0.1 arcseconds has been recorded on the Earth's surface in Antarctica. The typical seeing at premier astronomical observatories, such as those found in Hawaii, Chile or the Canaries, is between 0.5 and 1.0 arcseconds. The best we've recorded from the roof of the Physics building in Sheffield is about 2 arcseconds!


What to expect from telescope images

How big are stars in astronomical images? Let us try a thought experiment, and place a "typical star" very nearby. Let us assume our star is the same size as the Sun i.e \(R_{*} = 1 R_{\odot} = 7 \times 10^{8} m\). The nearest stars are at a distance of around 1 parsec, i.e \(d = 1\) pc \(\approx 3 \times 10^{16} m\). This hypothetical star would therefore subtend an angular size \(\alpha_{\rm act} = R_{*}/d = 2 \times 10^{-8}\) radians \(= 0.005\) arc seconds. This would be the radius of the star in our image, if diffraction or seeing were not an issue.

We have seen that, in the absence of seeing, the resolution limit of a telescope of diameter \(D\) is \(\alpha_{\rm resol} = 1.22 \lambda / D\). Using this formula, the diffraction limit of a 12-cm diameter telescope at optical wavelengths is around 1 arc second. Instead of the perfect star image we'd hope for, if we use a small telescope, we will see a diffraction pattern, with a central spot that has a radius of 1 arc second. Larger telescopes have higher resolving powers. A world-leading, 12-m diameter telescope has a diffraction limit around 0.01 arc seconds. Therefore, even if we ignore seeing, the very best telescopes in the world do not resolve nearby stars.

We cannot of course, ignore seeing. Recall that typical seeing at a good site is 0.5-1 arc seconds. Suppose the seeing is 0.5". For our 12 cm telescope this is smaller than the diffraction pattern, and so the blurring caused by the diffraction pattern would dominate. Such an image would be diffraction limited. In such an image, the stars would look like Airy discs, with sizes of 1 arc second.

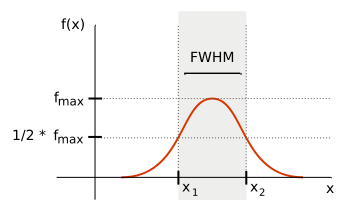
For our large telescope, the seeing is much worse than the diffraction, so we would be seeing limited, and would see images in which all the stellar profiles were Gaussians, with a FWHM set by the seeing.